
The Console User Interface
Follow these instructions to start the console.

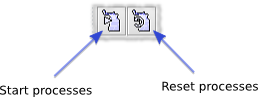
Process controls
The Start processes, Reset processes, and Stop processes menu items send signals to Grinder processes that are listening. (See the properties grinder.useConsole, grinder.consoleHost and consolePort.) Start processes and Reset processes are also tool bar buttons.
These controls will be disabled if no agents are connected to the console. You can check whether any agents are connected on the Processes tab.
Worker processes that are controlled by the console can be in one of three states:
- Initiated (waiting for a console signal)
- Running (performing tests, reporting to console)
- Finished (waiting for a console signal)
The Start processes control signals to worker processes that they should move into the running state. Processes that are already running will ignore this signal. Processes that are in the finished state exit; the agent process will then reread the properties file, and launch new worker processes in the running state.
The Reset processes control signals all the worker processes to exit. The agent process will then reread the properties file and launch new worker processes.
The Stop processes control signals all processes, including the agent processes, to exit. This is infrequently used, you usually want to use Reset processes instead.
Sample controls
The sample controls determine how the console captures reports from the worker processes. It is important to understand that these only control the console behaviour. For example, they do not adjust the frequency at which the worker processes send reports (see grinder.reportToConsole.interval for that). Additionally, the sample controls do not interact in any way with the process controls.
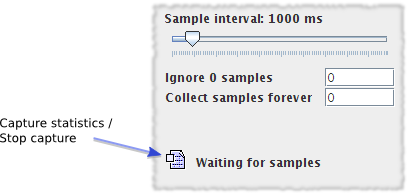
The slider controls the period at which the console will take a sample. This involves adding up all the reports received over that sample interval and calculating the TPS as (number of tests that occurred)/(interval length). It is also the period at which the console graphs and statistics are updated.
By default, the console starts updating the display and calculating totals from the first non-zero sample period. A non-zero sample period is one in which an update from a worker process was received. You can adjust how many non-zero sample periods the console ignores before starting capture with the ignore samples text field.
The third control allows you to adjust how many samples the console will collect before stopping capture.
You can also manually start and stop the sampling with the Capture statistics/Stop capture control. Use the Save statistics control to save the current set of statistics to a file.
The Graphs and Results tabs
On the console there are two tabs which display information about The Grinder and its tests. These are detailed below:
Graphs
Each graph displays the 25 most recent Tests Per Second (TPS) values for a particular test. A new value is added every console sample period. The y-axis is scaled so that the full height represents the peak TPS value received for the test since the display was last reset.
The colours are based on the relative response time. Long response times are more red, short response times are more yellow. This acts as an eye-catcher, allowing expensive tests to be easily spotted.
Results
The Results tab shows the results from The Grinder instrumentation.
| Test | The test number as specified in the test script, eg. tests[14000] will display as Test 14000. |
| Description | The test description as specified in the test script. |
| Successful Tests | The total number of iterations of the test that were successfully executed by The Grinder during the test run. |
| Errors | The total number of iterations of the test that failed to be fully executed by The Grinder during the test run. |
| Mean Time | The mean time taken to execute the test and receive the full response from the target server/application, in milliseconds. |
| Mean Time Standard Deviation | The mean standard deviation of the time taken to execute the test and receive the full response from the target server/application, in milliseconds. |
| TPS | Transactions per second. The average number of iterations of the test that successfully ran in a one second interval. |
| Peak TPS | Peak Transactions per second. The maximum number of iterations of the test that successfully ran in a one second interval. |
There is additional instrumentation provided by the HTTPPlugin.
| Mean Response Length | The mean size of HTTP response from the target server/application in response to the executed test, in bytes. |
| Response Bytes per Second | The mean number of bytes per second received from the target server/application, in bytes per second. This gives an indication of the amount of bandwidth being consumed by the test. This does not take into account the amount of traffic being sent to the target server/application. |
| Response Errors | The total number of HTTP Response Error Codes (eg, 404, 500 etc) received during the test run. |
| Mean Time to Resolve Host | The mean time taken to resolve the ip address of the target server from the Fully Qualified Domain Name, via hosts file or DNS, in milliseconds. This is the time relative to the start of the test iteration. |
| Mean Time to Establish Connection | The mean time taken to establish a tcp connection to the target server/application, in milliseconds. This is the time relative to the start of the test iteration. |
| Mean Time to First Byte | The mean time taken to receive the first byte of response from the target server/application, in milliseconds. This is the time relative to the start of the test iteration. |
Processes tab
This tab displays information about the Agents, their worker processes and associated threads.
| Process | The name of the process. A parent process will take the hostname of the box on which it is running Its child processes take the name of the parent process and add a suffix of "-x" where x is an integer, eg. myserver-0. |
| Type | The type of process, eg. Agent or Worker. |
| State | Information about the state of the process, eg. "Connected" for an agent process and "Running" and "Finished" for a Worker process. |
Script tab
This tab contains the console support for script editing and distribution. The distribution controls are also accessible through the Distribute menu.
To use the script distribution, follow these steps:
- Set the directory for the script distribution
- Create a script and a property file
- Select the properties file to use
- Distribute the changed files to the agents
- Start the Worker processes
Set the directory for the script distribution
The file tree on the left hand side of Script tab is shows the a view of local files on the console machine. Use the Distribute/Set directory... menu option or the tool bar button to set the distribution directory to the place where you want to store your scripts. All of the files below the directory will be distributed to the worker processes, so don't set it to /home or C:\.
If you are using The Grinder for the first time, you might like to set the distribution directory to the examples directory in The Grinder installation.
Create a script and a property file
You can use the console to create, view, and edit script files in the distribution directory. The editor is rudimentary, but good enough for basic editing.
If your script relies on other files (including Jython modules), copy them below the distribution directory.
You can also edit files in the distribution directory with a text editor of your choice. For convenience, you can define an external editor in the console options (File/Options.../Script Editor), and launch it by right-clicking on a file in the file tree and selecting Open with external editor.
Once you have your script ready, create a properties file. The file name extension should be properties, and unless you have many different properties files in the directory, the file is usually called grinder.properties. If your script is not called grinder.py, add a grinder.script property to your properties file:
grinder.script = myscript.py
The properties sent from the console are combined with any set in a grinder.properties file in the agent's working directory or set on the agent command line. If a property is specified in several places, the order of precedence is
- Properties sent by the console[most important]
- Properties set on the agent command line
- Properties in the agent's local grinder.properties file [least important]
Select the properties file to use
Right-click on the properties file and chose Select properties.
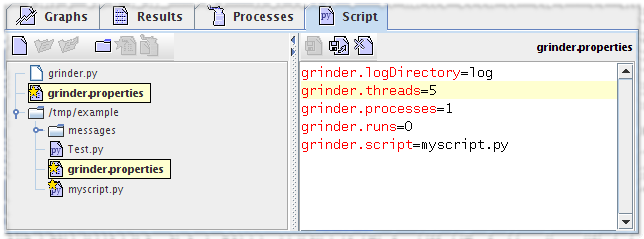
The properties file and the script to which it refers will be indicated with a star.
Distribute the changed files to the agents
Select the Distribute/Distribute files menu item, or click on the toolbar button.
Each agent maintains its own local cache of the files below the distribution directory. When you select Distribute files, any files that have changed will be sent to the agents. The distribution controls will only be enabled if one or more agents is connected to the console, and one or more files has been edited.
Start the Worker processes
Select Start processes as described above.
Internationalisation help wanted
If you are bilingual you might fancy translating the console into a language of your choice.